Housing Supply Gap Methodology
Our housing supply gap methodology aims to answer the question: how many units are available to households in each income level? To calculate this, we consider both the demand (the renter households in the study area) and the supply (the available rental units).
Demand
We first arrange all renter households in the given geography cumulatively based on their income:
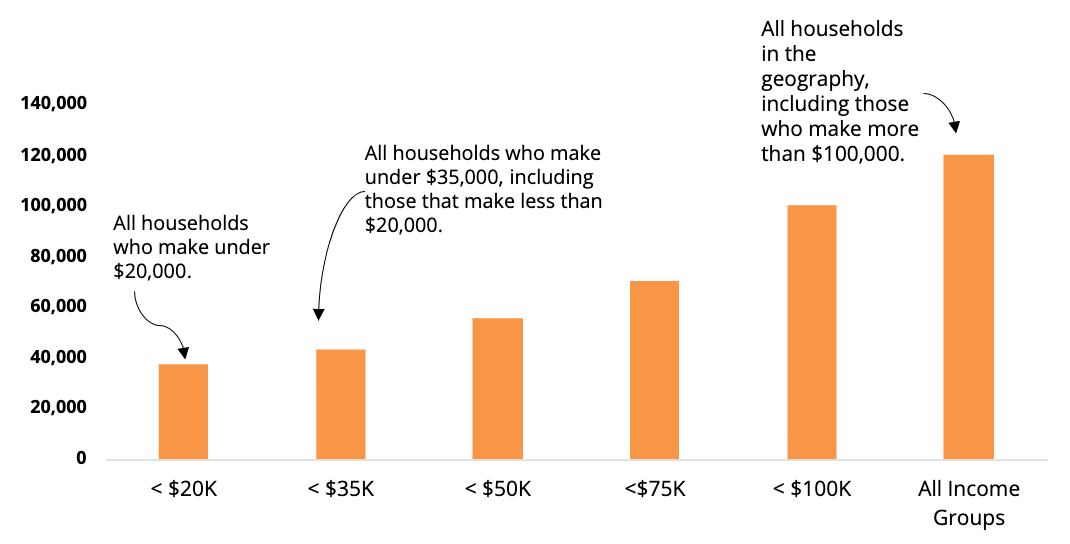
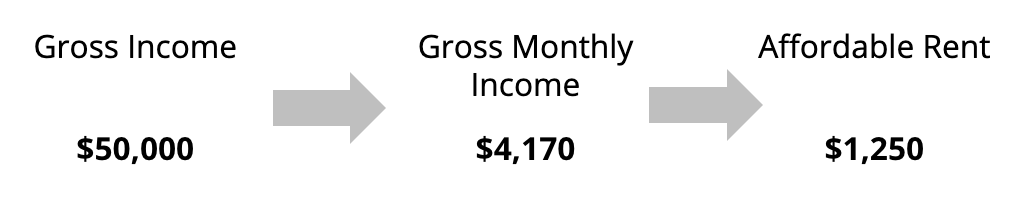
We then calculate how much each income group can afford to pay in rent without being cost burdened—defined by the Department of Housing and Urban Development as 30% of gross (pre-tax) monthly income.
Supply
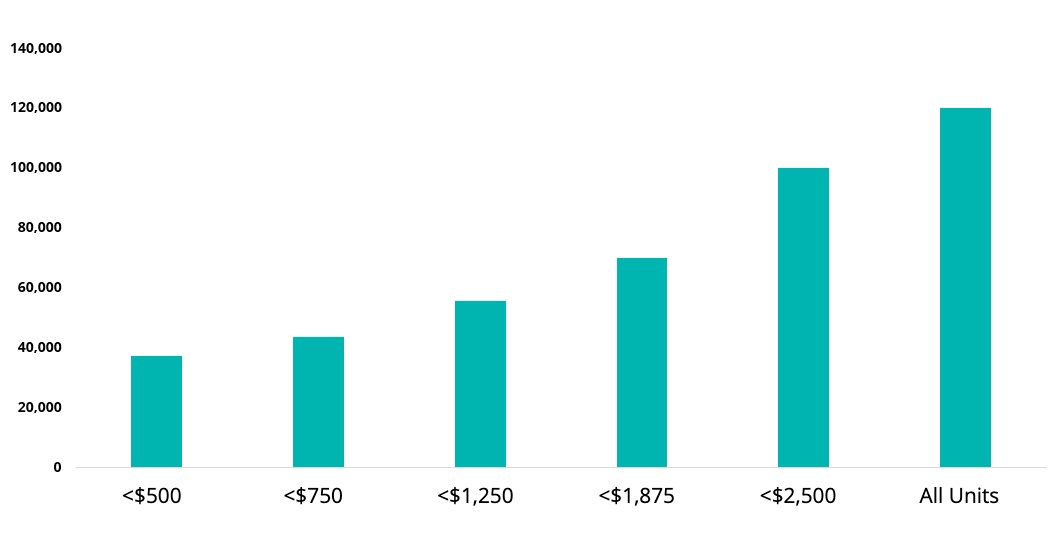
We then examine the geography's supply of available rental units, grouped by these rent limits.
Current Housing Gap
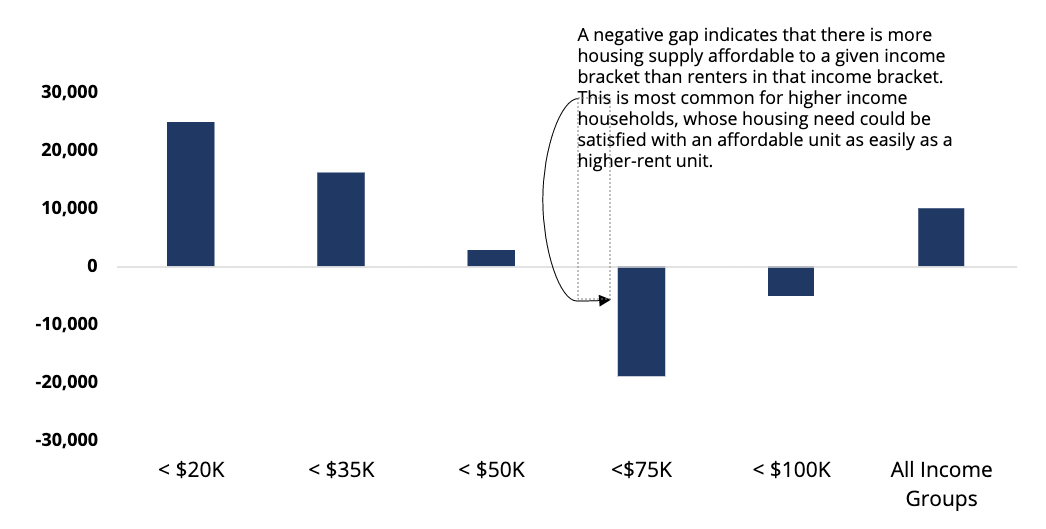
Arranging both the households and the units available allows us to calculate the supply gap.
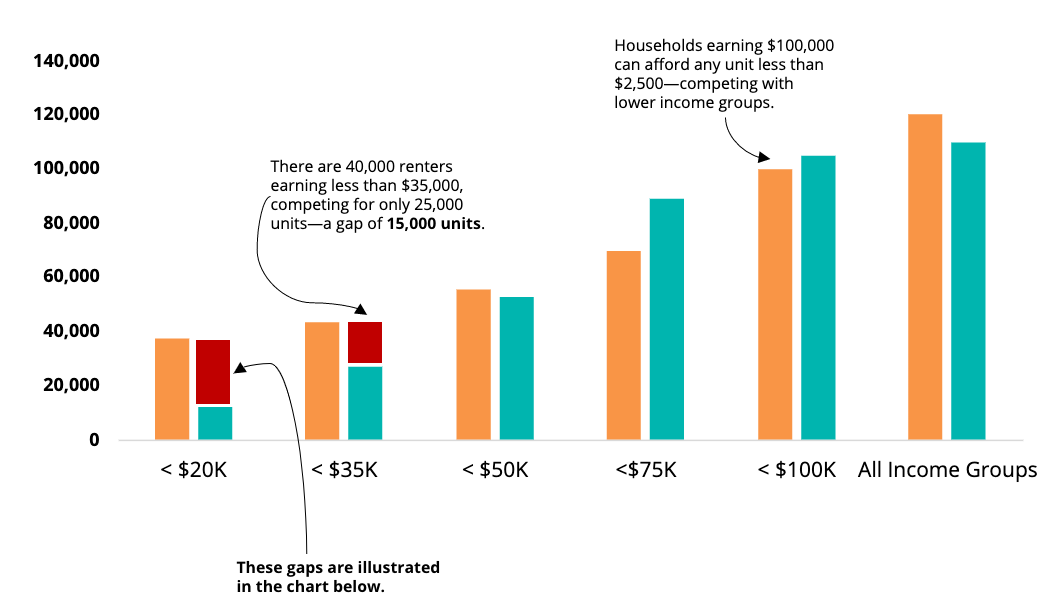
Unit Gap by Income Group
Future Supply Gap
For the future supply gap, we again projected demand and supply separately.
Future Demand
Using American Communities Survey historical tenure and renter income distribution data as well as population projections from the Florida Office of Economic and Demographic Research, HR&A estimated the 2030 share of renters across income levels.
Future Supply
Unit Loss
HR&A considered existing rent trends and loss of affordable units due to redevelopment or price increases over the last 5 years using National Housing Preservation Database and American Communities Survey housing data and projected out these existing trends to 2030.
Unit Increase
We then added new units to the future unit projections based on the counties long-term average units delivered annually from CoStar data to project the volume of future development.